Gene Information
|
Gene Name
|
ENPEP |
|
Gene ID
|
2028
|
|
Gene Full Name
|
glutamyl aminopeptidase |
|
Gene Alias
|
APA|CD249|gp160 |
|
Transcripts
|
ENSG00000138792
|
|
Virus
|
HTLV1 |
|
Gene Type
|
protein-coding |
|
HPA Location Info
|

|
|
Membrane Info
|
CD markers, Enzymes, Plasma proteins, Predicted membrane proteins |
|
Uniport_ID
|
Q07075
|
|
HGNC ID
|
HGNC:3355
|
|
OMIM ID
|
138297 |
|
Summary
|
The ENPEP gene encodes glutamyl aminopeptidase, a type II integral membrane protein with an extracellular zinc-binding domain. This protein can upregulate blood pressure by cleaving the N-terminal aspartate from angiotensin II, and can regulate blood vessel formation and enhance tumorigenesis in some tissues. Along with ANPEP and DPP4, ENPEP was found to be a candidate co-receptor for the coronavirus SARS-CoV-2, which causes COVID-19. [provided by RefSeq, Apr 2020] |
Target gene [ENPEP] related to VISs 
Integration Table: if previous studies reported that target gene was altered by virus integration events, the overlap between VISs in this literature and Cistrome factors was listed in this section
| DVID |
Chromosome |
HM |
TFBS |
CA |
Sum of Overlapped Records |
Detail |
| 6031495 |
chr4 |
0 |
0 |
0 |
0 |
View |
| 6032705 |
chr4 |
0 |
0 |
0 |
0 |
View |
Target gene [ENPEP] related to Omics data
| Data ID |
Experiment type |
Sample number |
Platform |
|
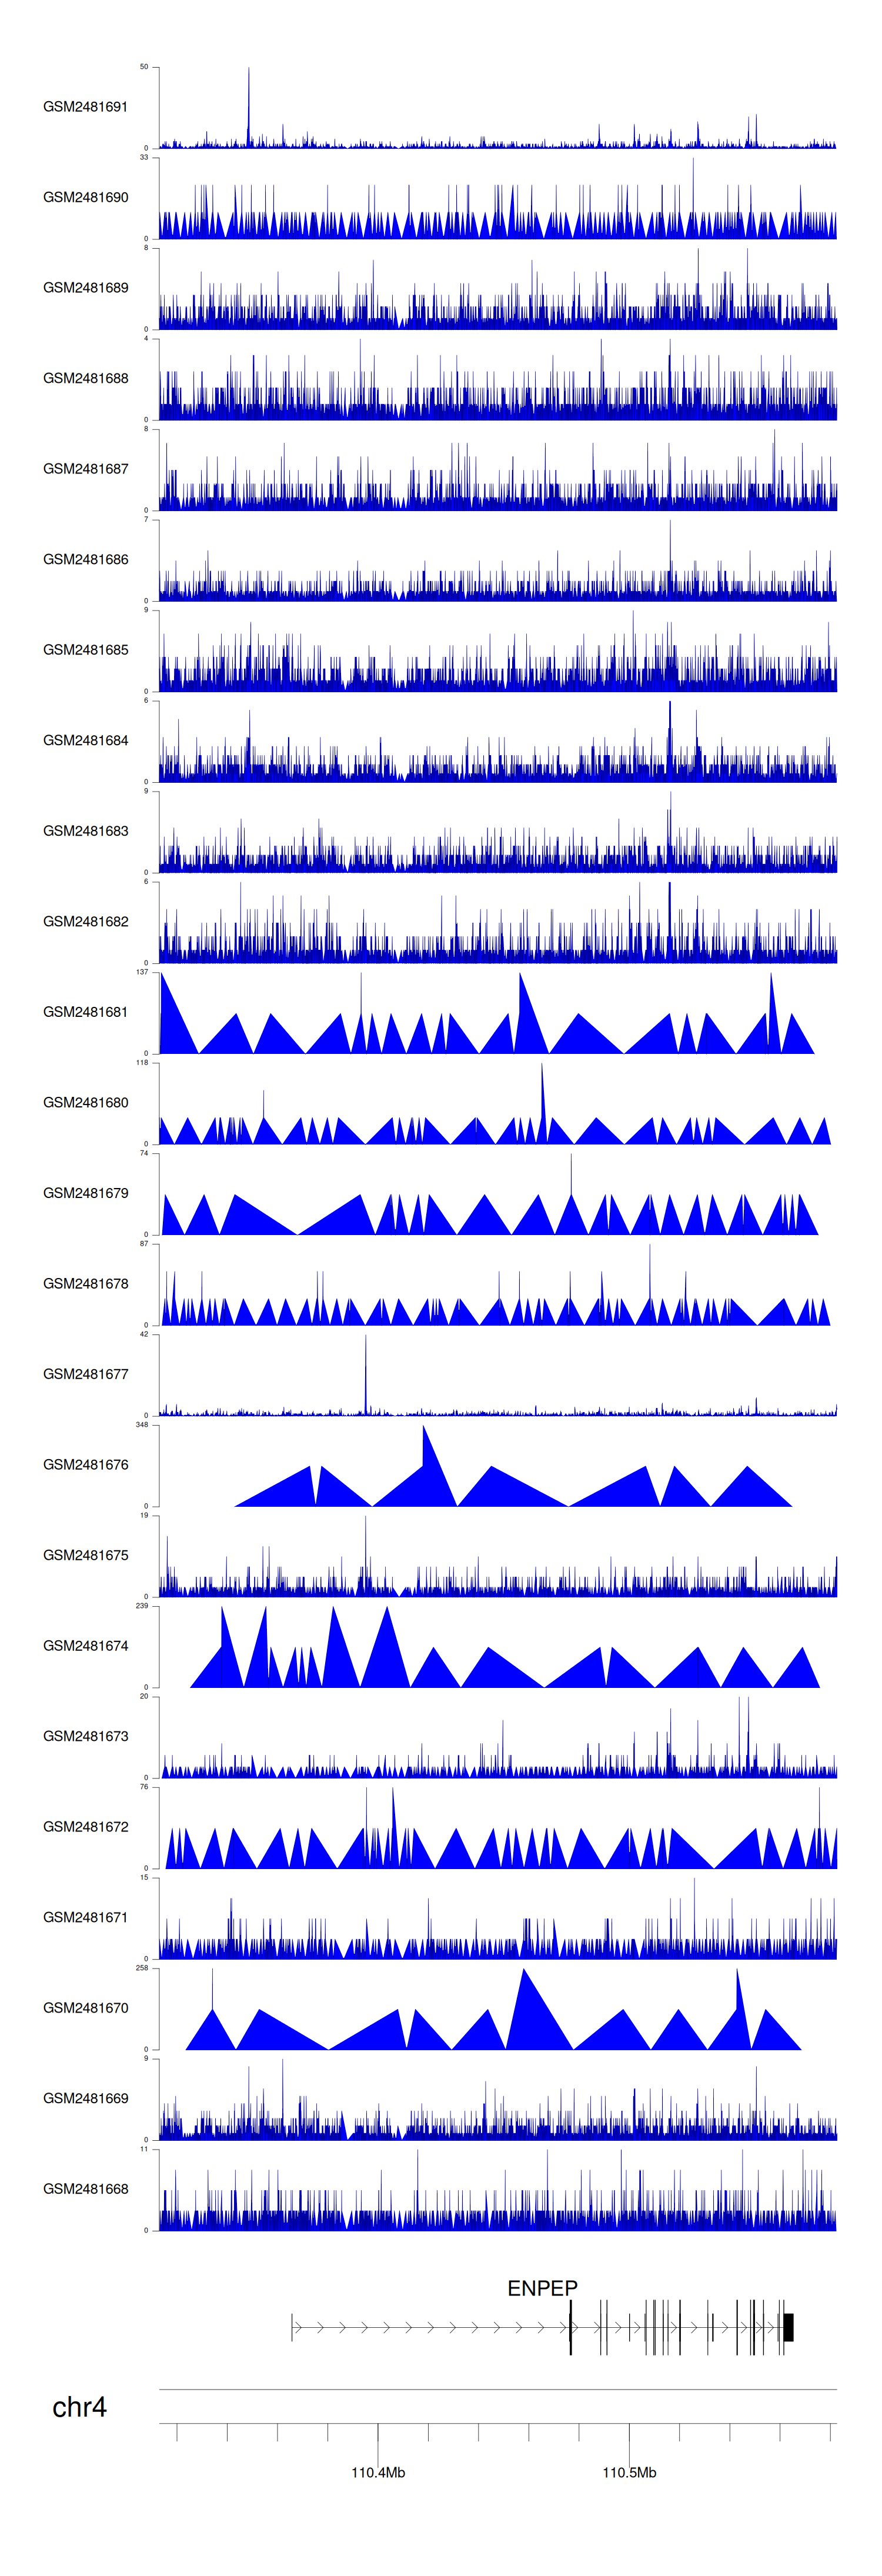
C GSE94732
|
Chip-seq |
24 |
Illumina NextSeq 500 (Homo sapiens);illumina Genome Analyzer IIx (Homo sapiens) |
|
GSE168557
|
Expression array |
6 |
Agilent-039494 SurePrint G3 Human GE v2 8x60K Microarray 039381 (Feature Number version) |
|
GSE52244
|
Expression array |
15 |
[HuEx-1_0-st] Affymetrix Human Exon 1.0 ST Array [probe set (exon) version] |
|
GSE10789
|
Expression array |
6 |
NCI/ATC Hs-OperonV3 |
|
GSE189602
|
Methylation profiling (Array) |
4 |
Infinium MethylationEPIC |
|
GSE136189
|
Methylation profiling (Array) |
40 |
Illumina HumanMethylation450 BeadChip (HumanMethylation450_15017482);Illumina Infinium HumanMethylation850 BeadChip |
When the gene can detect a peak in the dataset, a peak plot will be displayed.
> Dataset: GSE94732 - ENPEP peak across samples
|
Peak Plot
|
|
|