Gene Information
|
Gene Name
|
FBH1 |
|
Gene ID
|
84893
|
|
Gene Full Name
|
F-box DNA helicase 1 |
|
Gene Alias
|
FBXO18|Fbx18|hFBH1 |
|
Transcripts
|
ENSG00000134452
|
|
Virus
|
HTLV1 |
|
Gene Type
|
protein-coding |
|
HPA Location Info
|

|
|
Membrane Info
|
Disease related genes, Enzymes, Plasma proteins, Potential drug targets, Predicted membrane proteins |
|
Uniport_ID
|
Q8NFZ0
|
|
HGNC ID
|
HGNC:13620
|
|
OMIM ID
|
607222 |
|
Summary
|
This gene encodes a member of the F-box protein family, members of which are characterized by an approximately 40 amino acid motif, the F-box. The F-box proteins constitute one of the four subunits of ubiquitin protein ligase complex called SCFs (SKP1-cullin-F-box), which function in phosphorylation-dependent ubiquitination. The F-box proteins are divided into three classes: Fbws containing WD-40 domains, Fbls containing leucine-rich repeats, and Fbxs containing either different protein-protein interaction modules or no recognizable motifs. The protein encoded by this gene belongs to the Fbx class. It contains an F-box motif and seven conserved helicase motifs, and has both DNA-dependent ATPase and DNA unwinding activities. Alternatively spliced transcript variants encoding distinct isoforms have been identified for this gene. [provided by RefSeq, Jul 2008] |
Target gene [FBH1] related to VISs 
Integration Table: if previous studies reported that target gene was altered by virus integration events, the overlap between VISs in this literature and Cistrome factors was listed in this section
| DVID |
Chromosome |
HM |
TFBS |
CA |
Sum of Overlapped Records |
Detail |
| 6001150 |
chr10 |
448 |
99 |
18 |
565 |
View |
Target gene [FBH1] related to Omics data
| Data ID |
Experiment type |
Sample number |
Platform |
|
GSE52244
|
Expression array |
15 |
[HuEx-1_0-st] Affymetrix Human Exon 1.0 ST Array [probe set (exon) version] |
|
GSE224047
|
RNA-seq |
10 |
Illumina NextSeq 500 (Homo sapiens) |
|
C GSE94732
|
Chip-seq |
24 |
Illumina NextSeq 500 (Homo sapiens);illumina Genome Analyzer IIx (Homo sapiens) |
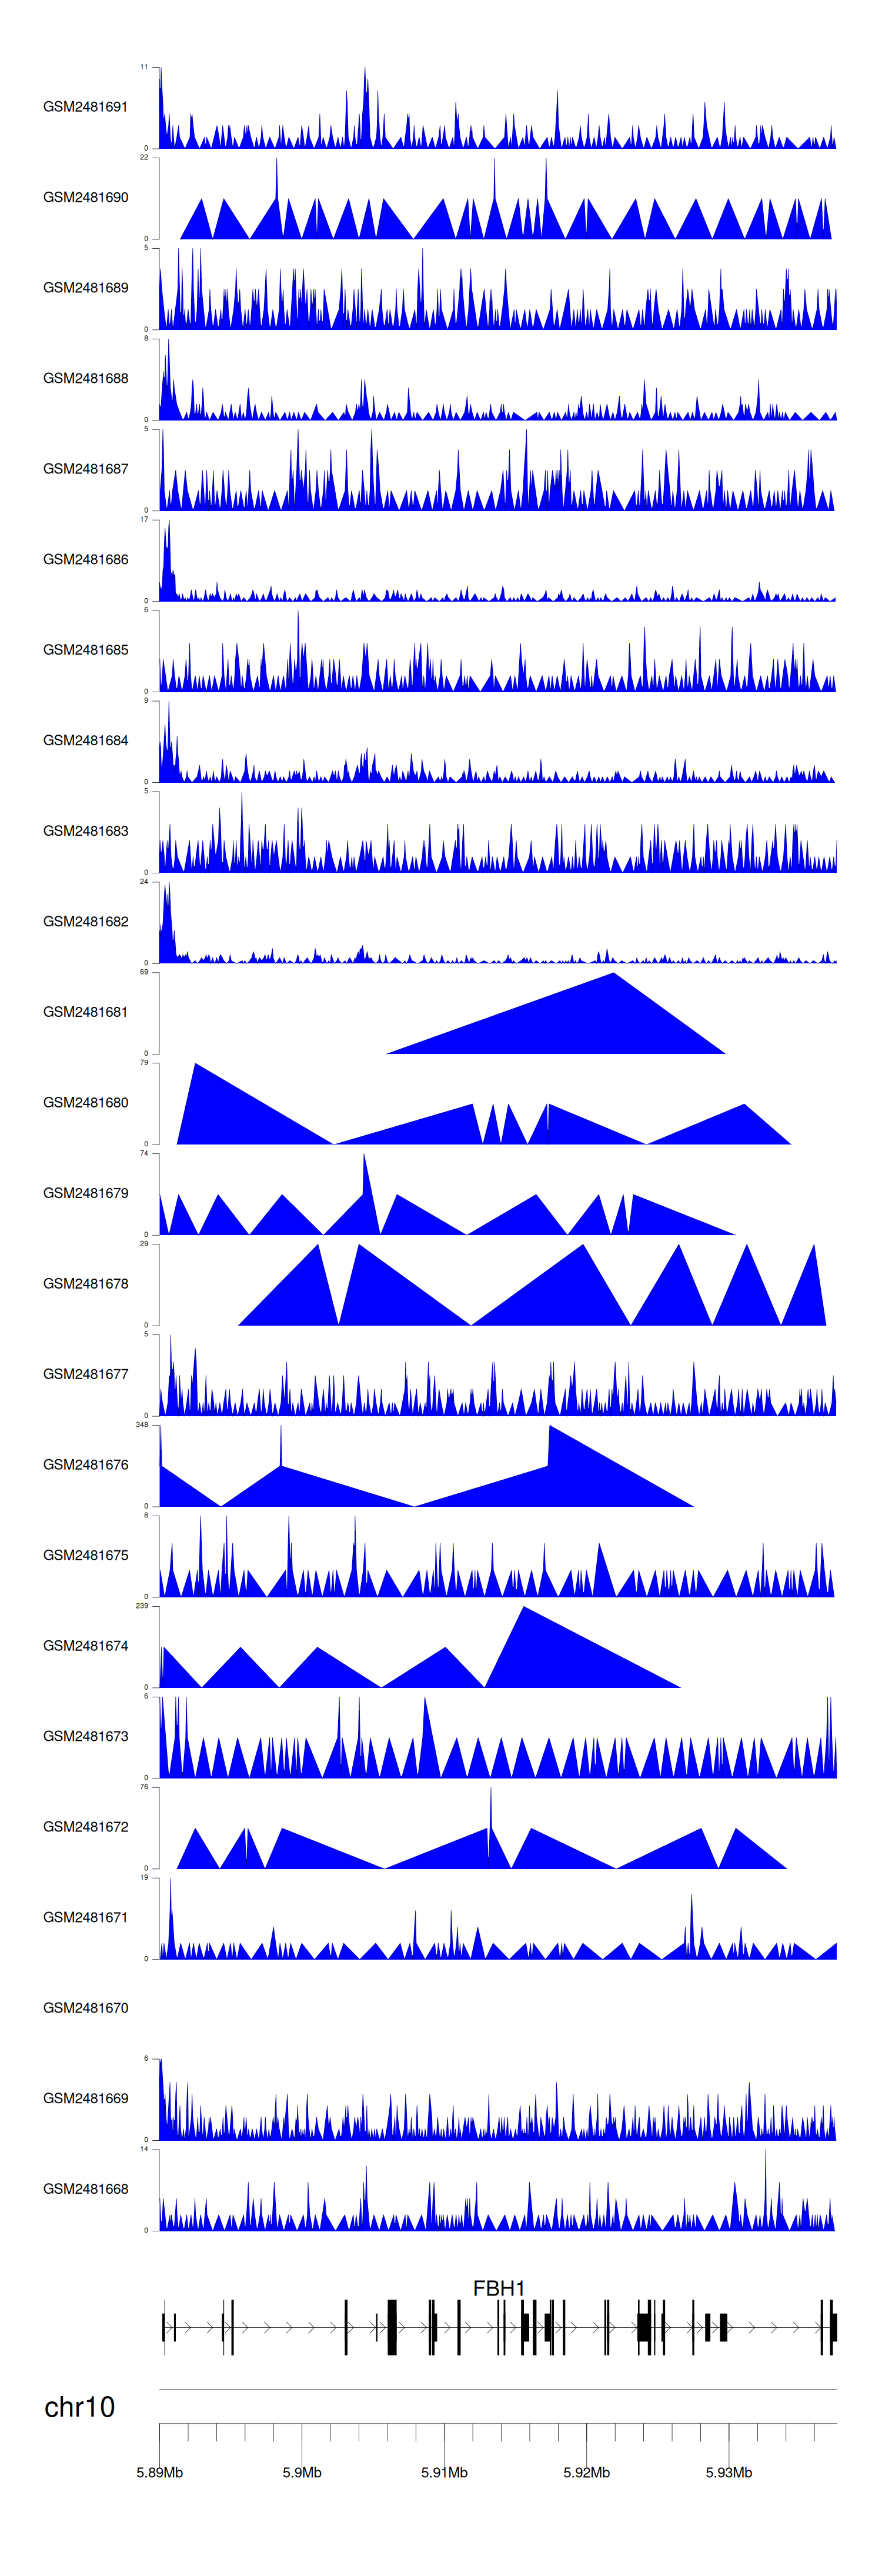
When the gene can detect a peak in the dataset, a peak plot will be displayed.
> Dataset: GSE94732 - FBH1 peak across samples
|
Peak Plot
|
|
|