Gene Information
|
Gene Name
|
FBXL16 |
|
Gene ID
|
146330
|
|
Gene Full Name
|
F-box and leucine rich repeat protein 16 |
|
Gene Alias
|
C16orf22|Fbl16|c380A1.1 |
|
Transcripts
|
ENSG00000127585
|
|
Virus
|
HTLV1 |
|
Gene Type
|
protein-coding |
|
HPA Location Info
|

|
|
Membrane Info
|
Predicted intracellular proteins |
|
Uniport_ID
|
Q8N461
|
|
HGNC ID
|
HGNC:14150
|
|
OMIM ID
|
609082 |
|
Summary
|
Members of the F-box protein family, such as FBXL16, are characterized by an approximately 40-amino acid F-box motif. SCF complexes, formed by SKP1 (MIM 601434), cullin (see CUL1; MIM 603134), and F-box proteins, act as protein-ubiquitin ligases. F-box proteins interact with SKP1 through the F box, and they interact with ubiquitination targets through other protein interaction domains (Jin et al., 2004 [PubMed 15520277]).[supplied by OMIM, Mar 2008] |
Target gene [FBXL16] related to VISs 
Integration Table: if previous studies reported that target gene was altered by virus integration events, the overlap between VISs in this literature and Cistrome factors was listed in this section
| DVID |
Chromosome |
HM |
TFBS |
CA |
Sum of Overlapped Records |
Detail |
| 6000230 |
chr16 |
1713 |
761 |
268 |
2742 |
View |
Target gene [FBXL16] related to Omics data
| Data ID |
Experiment type |
Sample number |
Platform |
|
GSE189602
|
Methylation profiling (Array) |
4 |
Infinium MethylationEPIC |
|
C GSE94732
|
Chip-seq |
24 |
Illumina NextSeq 500 (Homo sapiens);illumina Genome Analyzer IIx (Homo sapiens) |
|
GSE52244
|
Expression array |
15 |
[HuEx-1_0-st] Affymetrix Human Exon 1.0 ST Array [probe set (exon) version] |
|
GSE10789
|
Expression array |
6 |
NCI/ATC Hs-OperonV3 |
|
GSE224047
|
RNA-seq |
10 |
Illumina NextSeq 500 (Homo sapiens) |
|
GSE168557
|
Expression array |
6 |
Agilent-039494 SurePrint G3 Human GE v2 8x60K Microarray 039381 (Feature Number version) |
|
GSE136189
|
Methylation profiling (Array) |
40 |
Illumina HumanMethylation450 BeadChip (HumanMethylation450_15017482);Illumina Infinium HumanMethylation850 BeadChip |
When the gene can detect a peak in the dataset, a peak plot will be displayed.
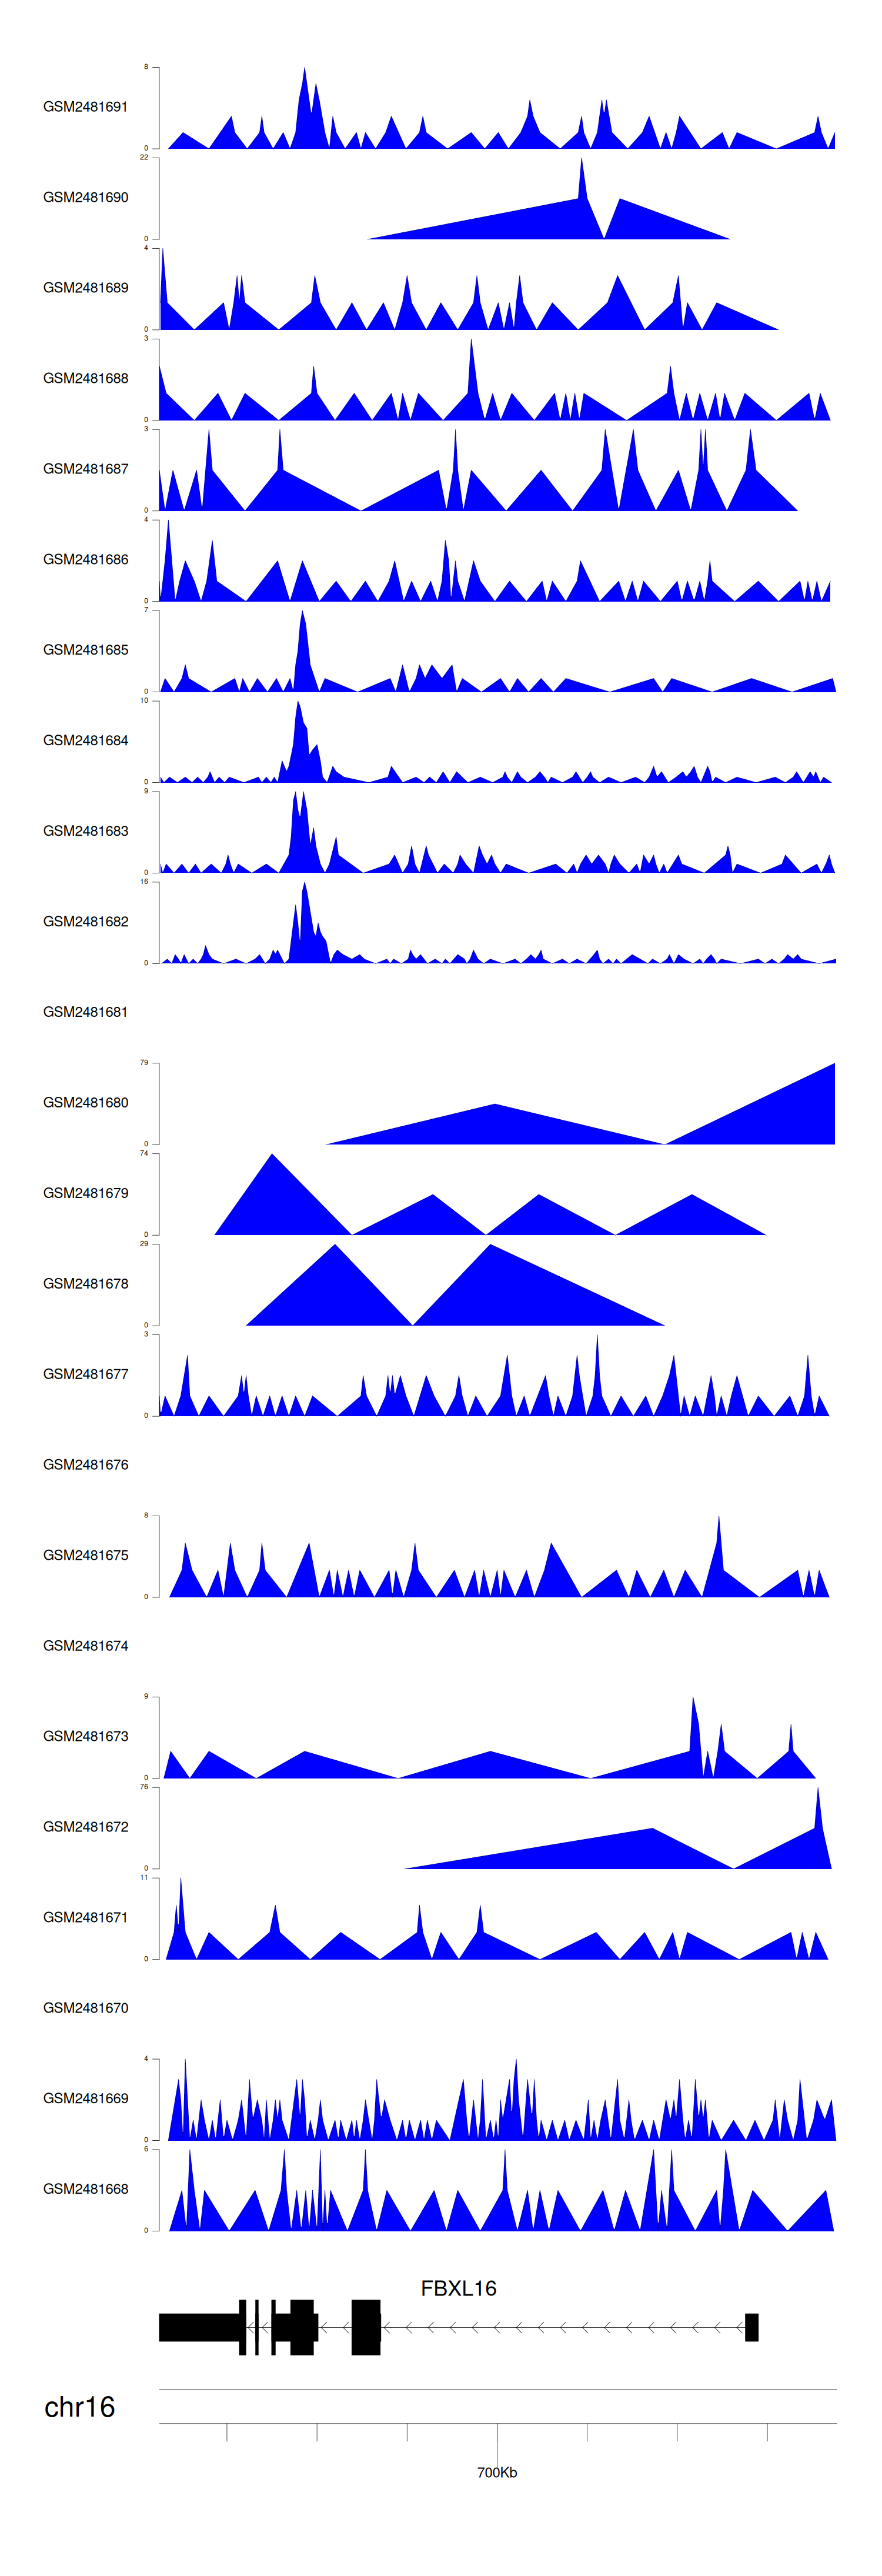
> Dataset: GSE94732 - FBXL16 peak across samples
|
Peak Plot
|
|
|