Gene Information
|
Gene Name
|
FOSL2 |
|
Gene ID
|
2355
|
|
Gene Full Name
|
FOS like 2, AP-1 transcription factor subunit |
|
Gene Alias
|
ACED|FRA2 |
|
Transcripts
|
ENSG00000075426
|
|
Virus
|
HTLV1 |
|
Gene Type
|
protein-coding |
|
HPA Location Info
|
Nucleoplasm; 
|
|
Membrane Info
|
Predicted intracellular proteins, Transcription factors |
|
Uniport_ID
|
P15408
|
|
HGNC ID
|
HGNC:3798
|
|
OMIM ID
|
601575 |
|
Summary
|
The Fos gene family consists of 4 members: FOS, FOSB, FOSL1, and FOSL2. These genes encode leucine zipper proteins that can dimerize with proteins of the JUN family, thereby forming the transcription factor complex AP-1. As such, the FOS proteins have been implicated as regulators of cell proliferation, differentiation, and transformation. [provided by RefSeq, Jul 2014] |
Target gene [FOSL2] related to VISs 
Integration Table: if previous studies reported that target gene was altered by virus integration events, the overlap between VISs in this literature and Cistrome factors was listed in this section
| DVID |
Chromosome |
HM |
TFBS |
CA |
Sum of Overlapped Records |
Detail |
| 6000882 |
chr2 |
108 |
244 |
404 |
756 |
View |
Target gene [FOSL2] related to Omics data
| Data ID |
Experiment type |
Sample number |
Platform |
|
GSE189602
|
Methylation profiling (Array) |
4 |
Infinium MethylationEPIC |
|
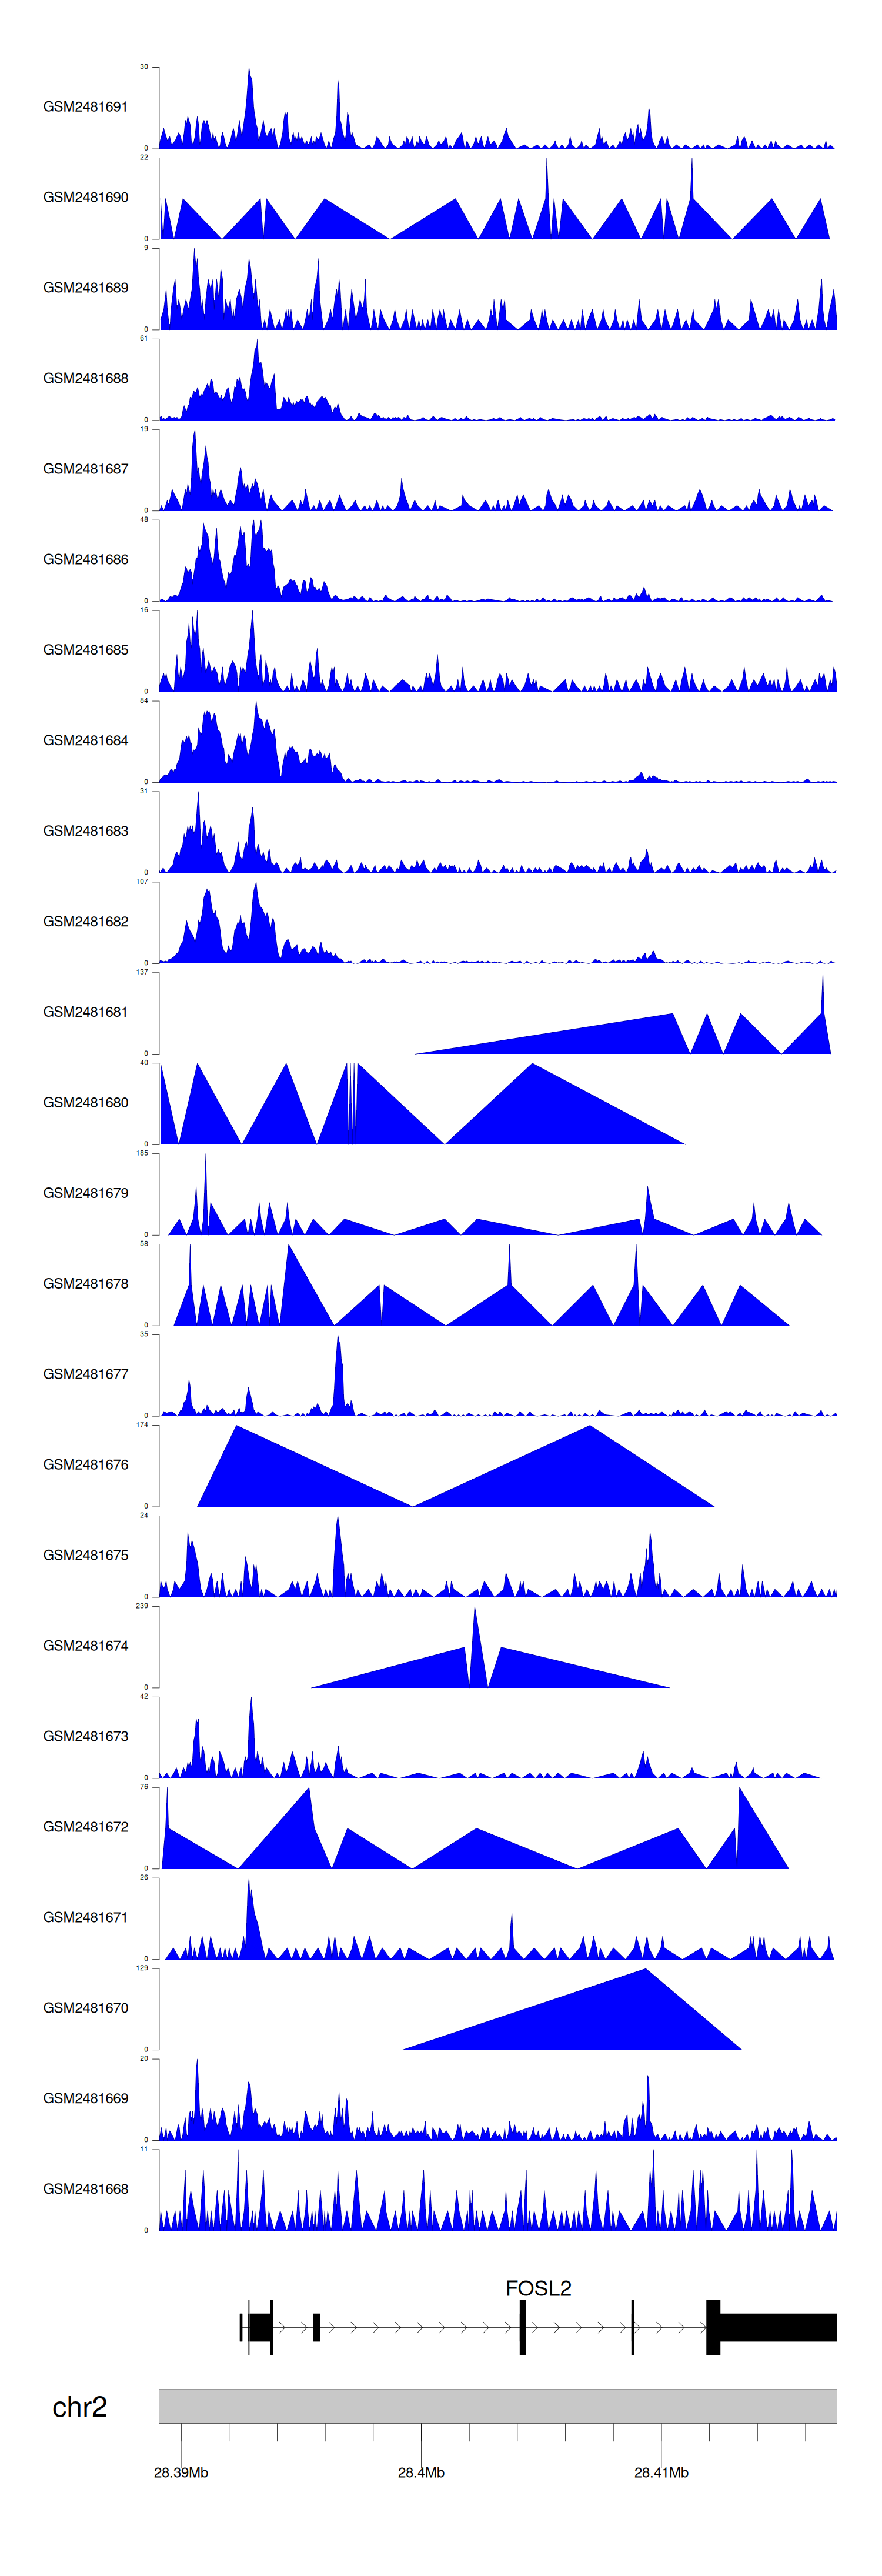
C GSE94732
|
Chip-seq |
24 |
Illumina NextSeq 500 (Homo sapiens);illumina Genome Analyzer IIx (Homo sapiens) |
|
GSE52244
|
Expression array |
15 |
[HuEx-1_0-st] Affymetrix Human Exon 1.0 ST Array [probe set (exon) version] |
|
GSE19080
|
Expression array |
38 |
Homo sapiens 3K Immunoarray2 HTLV-1 JH |
|
GSE10789
|
Expression array |
6 |
NCI/ATC Hs-OperonV3 |
|
GSE224047
|
RNA-seq |
10 |
Illumina NextSeq 500 (Homo sapiens) |
|
GSE168557
|
Expression array |
6 |
Agilent-039494 SurePrint G3 Human GE v2 8x60K Microarray 039381 (Feature Number version) |
|
GSE136189
|
Methylation profiling (Array) |
40 |
Illumina HumanMethylation450 BeadChip (HumanMethylation450_15017482);Illumina Infinium HumanMethylation850 BeadChip |
When the gene can detect a peak in the dataset, a peak plot will be displayed.
> Dataset: GSE94732 - FOSL2 peak across samples
|
Peak Plot
|
|
|