Gene Information
|
Gene Name
|
HAUS1 |
|
Gene ID
|
115106
|
|
Gene Full Name
|
HAUS augmin like complex subunit 1 |
|
Gene Alias
|
CCDC5|HEI-C|HEIC|HsT1461 |
|
Transcripts
|
ENSG00000152240
|
|
Virus
|
HTLV1 |
|
Gene Type
|
protein-coding |
|
HPA Location Info
|
Cytosol;Centrosome, Mid piece, End piece; 
|
|
Membrane Info
|
Predicted intracellular proteins |
|
Uniport_ID
|
Q96CS2
|
|
HGNC ID
|
HGNC:25174
|
|
OMIM ID
|
608775 |
|
Summary
|
HAUS1 is 1 of 8 subunits of the 390-kD human augmin complex, or HAUS complex. The augmin complex was first identified in Drosophila, and its name comes from the Latin verb 'augmentare,' meaning 'to increase.' The augmin complex is a microtubule-binding complex involved in microtubule generation within the mitotic spindle and is vital to mitotic spindle assembly (Goshima et al., 2008 [PubMed 18443220]; Uehara et al., 2009 [PubMed 19369198]).[supplied by OMIM, Jun 2010] |
Target gene [HAUS1] related to VISs 
Integration Table: if previous studies reported that target gene was altered by virus integration events, the overlap between VISs in this literature and Cistrome factors was listed in this section
| DVID |
Chromosome |
HM |
TFBS |
CA |
Sum of Overlapped Records |
Detail |
| 6008867 |
chr18 |
40 |
1 |
0 |
41 |
View |
Target gene [HAUS1] related to Omics data
| Data ID |
Experiment type |
Sample number |
Platform |
|
GSE189602
|
Methylation profiling (Array) |
4 |
Infinium MethylationEPIC |
|
C GSE94732
|
Chip-seq |
24 |
Illumina NextSeq 500 (Homo sapiens);illumina Genome Analyzer IIx (Homo sapiens) |
|
GSE52244
|
Expression array |
15 |
[HuEx-1_0-st] Affymetrix Human Exon 1.0 ST Array [probe set (exon) version] |
|
GSE10789
|
Expression array |
6 |
NCI/ATC Hs-OperonV3 |
|
GSE224047
|
RNA-seq |
10 |
Illumina NextSeq 500 (Homo sapiens) |
|
GSE168557
|
Expression array |
6 |
Agilent-039494 SurePrint G3 Human GE v2 8x60K Microarray 039381 (Feature Number version) |
|
GSE136189
|
Methylation profiling (Array) |
40 |
Illumina HumanMethylation450 BeadChip (HumanMethylation450_15017482);Illumina Infinium HumanMethylation850 BeadChip |
When the gene can detect a peak in the dataset, a peak plot will be displayed.
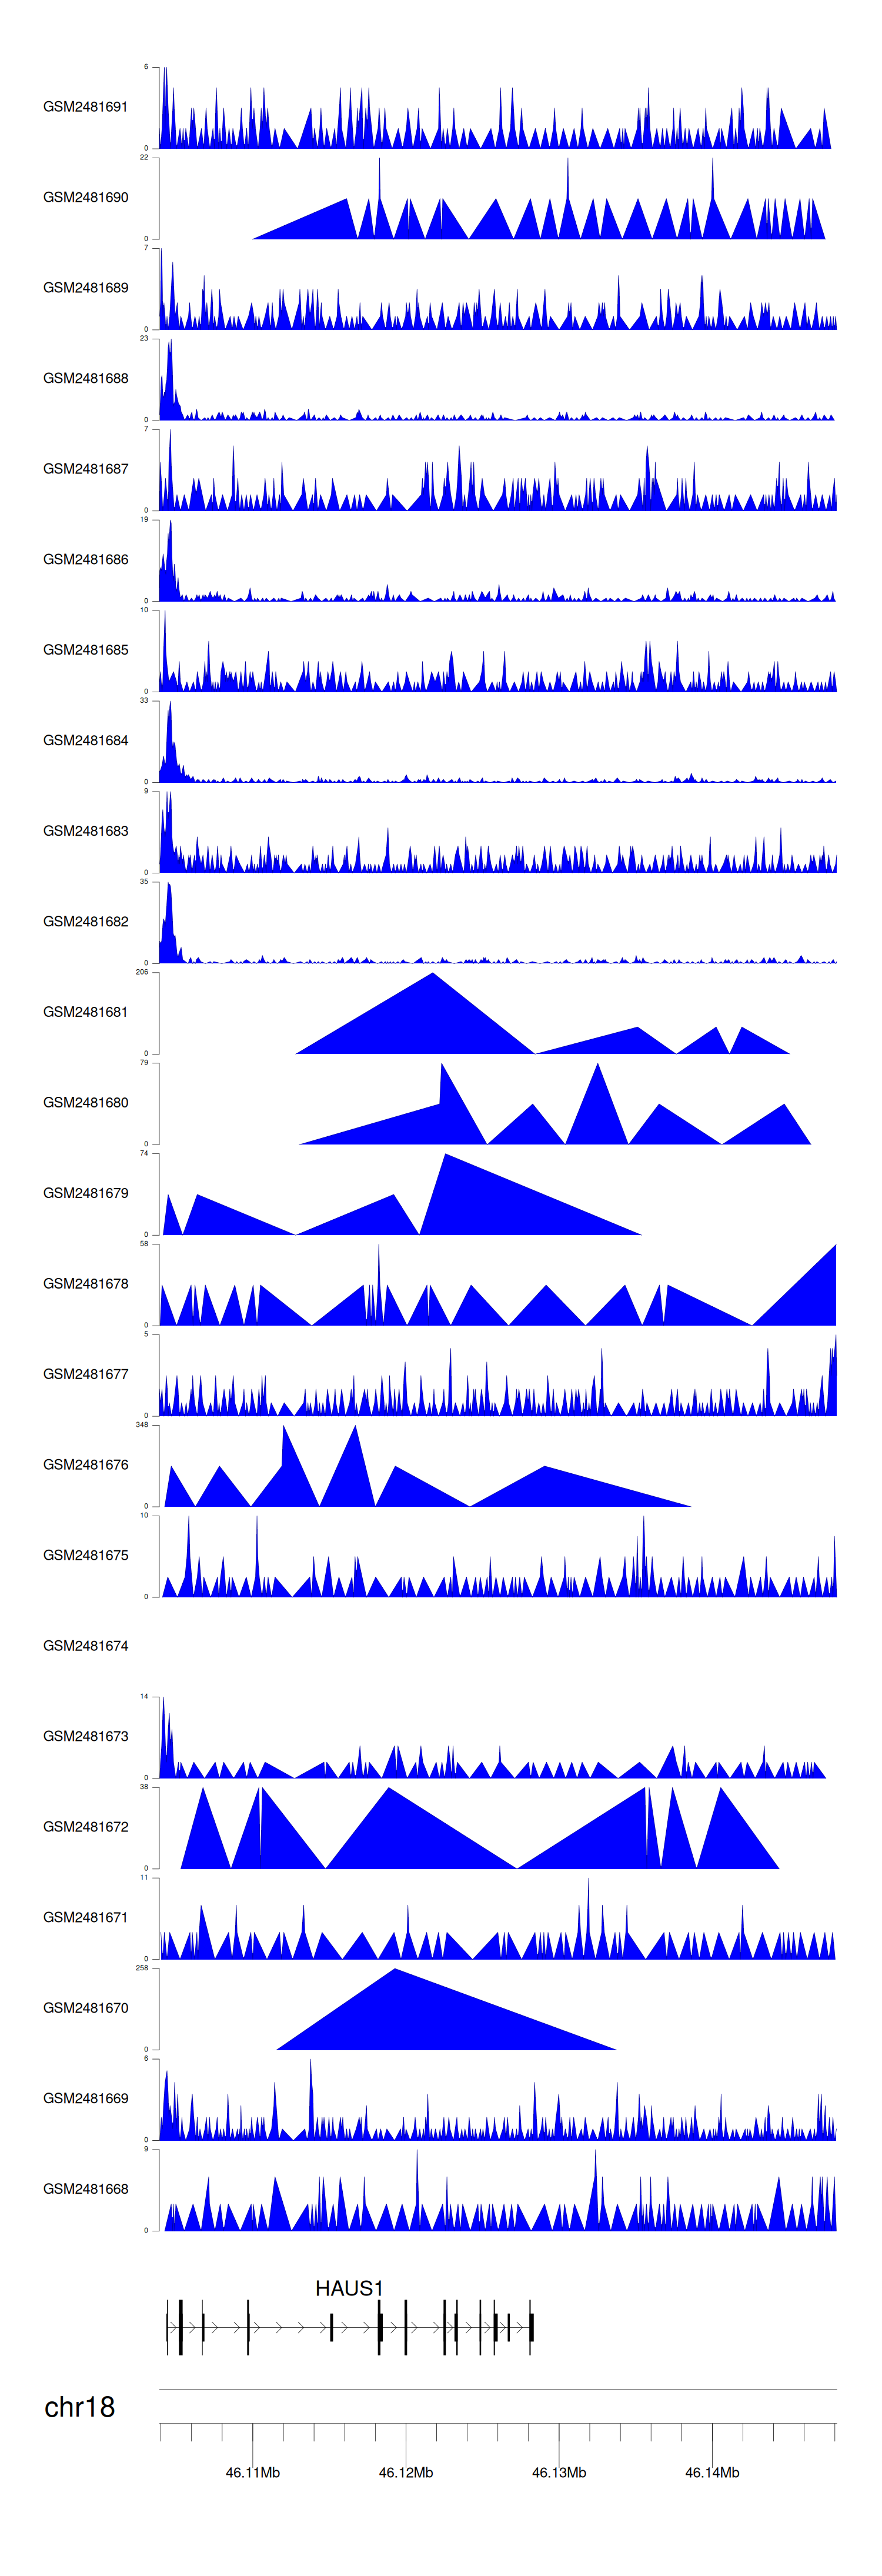
> Dataset: GSE94732 - HAUS1 peak across samples
|
Peak Plot
|
|
|