Gene Information
|
Gene Name
|
HERC2 |
|
Gene ID
|
8924
|
|
Gene Full Name
|
HECT and RLD domain containing E3 ubiquitin protein ligase 2 |
|
Gene Alias
|
D15F37S1|MRT38|SHEP1|jdf2|p528 |
|
Transcripts
|
ENSG00000128731
|
|
Virus
|
HBV |
|
Gene Type
|
protein-coding |
|
HPA Location Info
|
Cytosol;Plasma membrane; 
|
|
Membrane Info
|
Disease related genes, Enzymes, Human disease related genes, Metabolic proteins, Potential drug targets, Predicted intracellular proteins, Predicted membrane proteins |
|
Uniport_ID
|
O95714
|
|
HGNC ID
|
HGNC:4868
|
|
OMIM ID
|
605837 |
|
Summary
|
This gene belongs to the HERC gene family that encodes a group of unusually large proteins, which contain multiple structural domains. All members have at least 1 copy of an N-terminal region showing homology to the cell cycle regulator RCC1 and a C-terminal HECT (homologous to E6-AP C terminus) domain found in a number of E3 ubiquitin protein ligases. Genetic variations in this gene are associated with skin/hair/eye pigmentation variability. Multiple pseudogenes of this gene are located on chromosomes 15 and 16. [provided by RefSeq, Mar 2012] |
Target gene [HERC2] related to VISs 
Integration Table: if previous studies reported that target gene was altered by virus integration events, the overlap between VISs in this literature and Cistrome factors was listed in this section
| DVID |
Chromosome |
HM |
TFBS |
CA |
Sum of Overlapped Records |
Detail |
| 1004477 |
chr15 |
73 |
6 |
0 |
79 |
View |
| 1022063 |
chr15 |
73 |
6 |
0 |
79 |
View |
Target gene [HERC2] related to Omics data
| Data ID |
Experiment type |
Sample number |
Platform |
|
GSE236281
|
RNA-seq |
12 |
Illumina MiSeq (Homo sapiens) |
|
C GSE68402
|
Chip-seq |
26 |
Illumina MiSeq (Homo sapiens);Illumina HiSeq 2500 (Homo sapiens) |
|
GSE247322
|
scRNA-seq |
27 |
Illumina NovaSeq 6000 (Homo sapiens) |
|
TCGA_LIHC_HBV
|
DNA methylation sequencing;RNA-seq |
97 |
TCGA |
|
C GSE270130
|
Chip-seq |
27 |
Illumina NovaSeq 6000 (Homo sapiens) |
|
GSE224901
|
RNA-seq |
21 |
Illumina NovaSeq 6000 (Homo sapiens) |
|
GSE100400
|
Chip-seq;RNA-seq;4C_cccDNA |
31 |
Illumina NextSeq 500 (Homo sapiens);Illumina NextSeq 500 (Mus musculus) |
|
GSE173897
|
RNA-seq |
95 |
Illumina HiSeq 4000 (Homo sapiens) |
|
GSE262515
|
RNA-seq |
21 |
Illumina HiSeq 2500 (Homo sapiens);Illumina HiSeq 2500 (Mus musculus) |
|
GSE110345
|
RNA-seq |
4 |
Illumina HiSeq 2500 (Homo sapiens) |
|
C GSE131257
|
ATAC-seq;RNA-seq |
19 |
Illumina HiSeq 2500 (Homo sapiens) |
|
GSE94660
|
RNA-seq |
42 |
Illumina HiSeq 2500 (Homo sapiens) |
When the gene can detect a peak in the dataset, a peak plot will be displayed.
> Dataset: GSE68402 - HERC2 peak across samples
|
Peak Plot
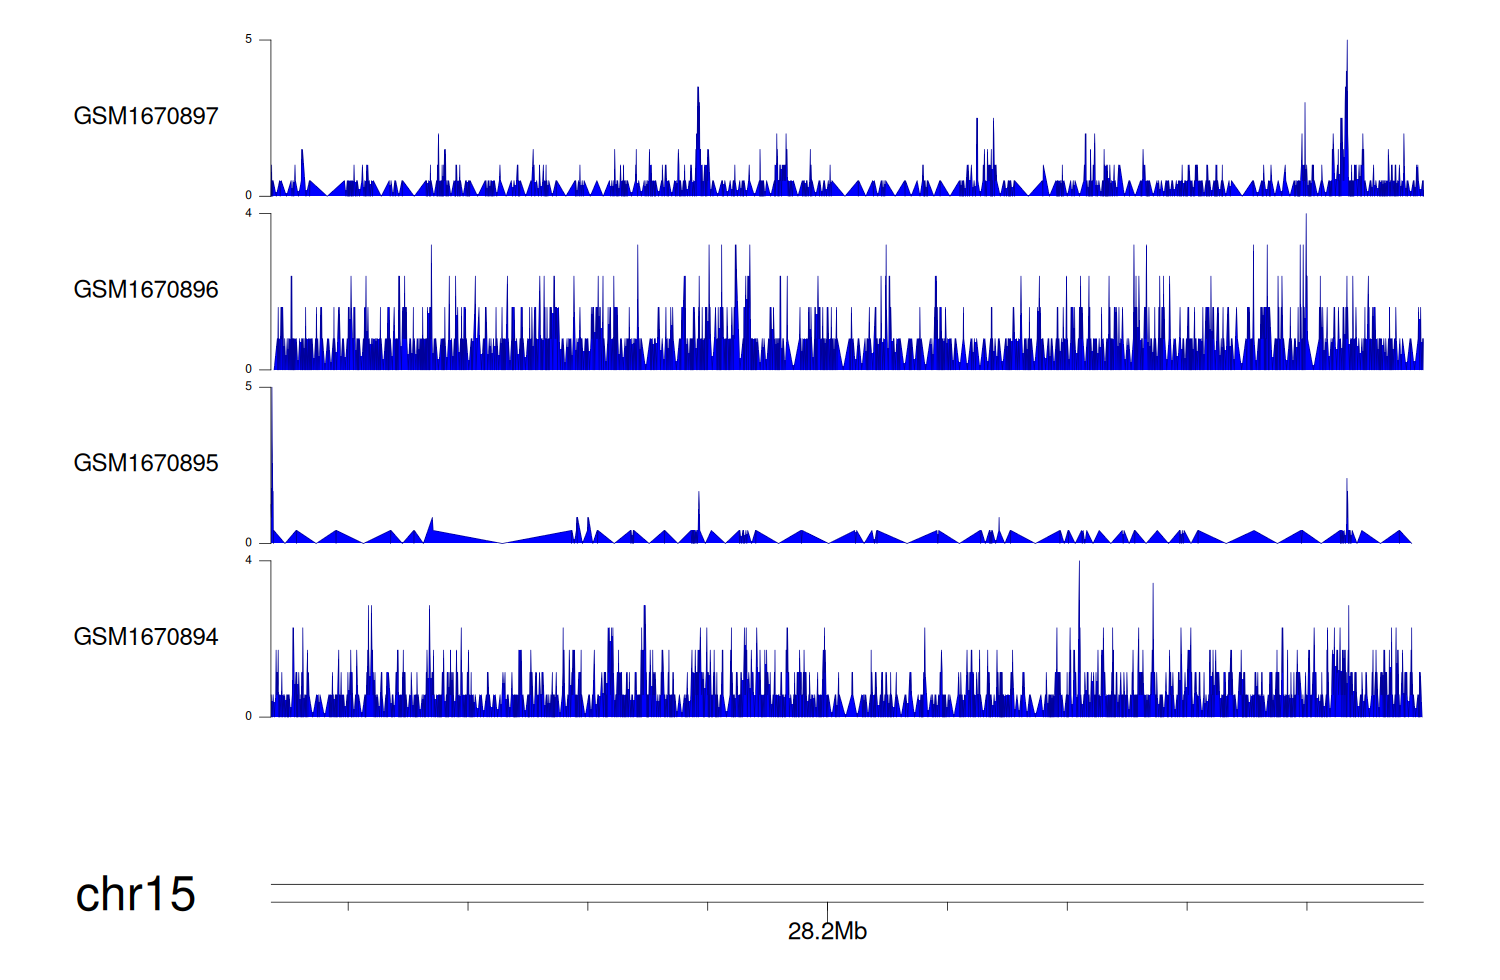
|
> Dataset: GSE270130 - HERC2 peak across samples
|
Peak Plot
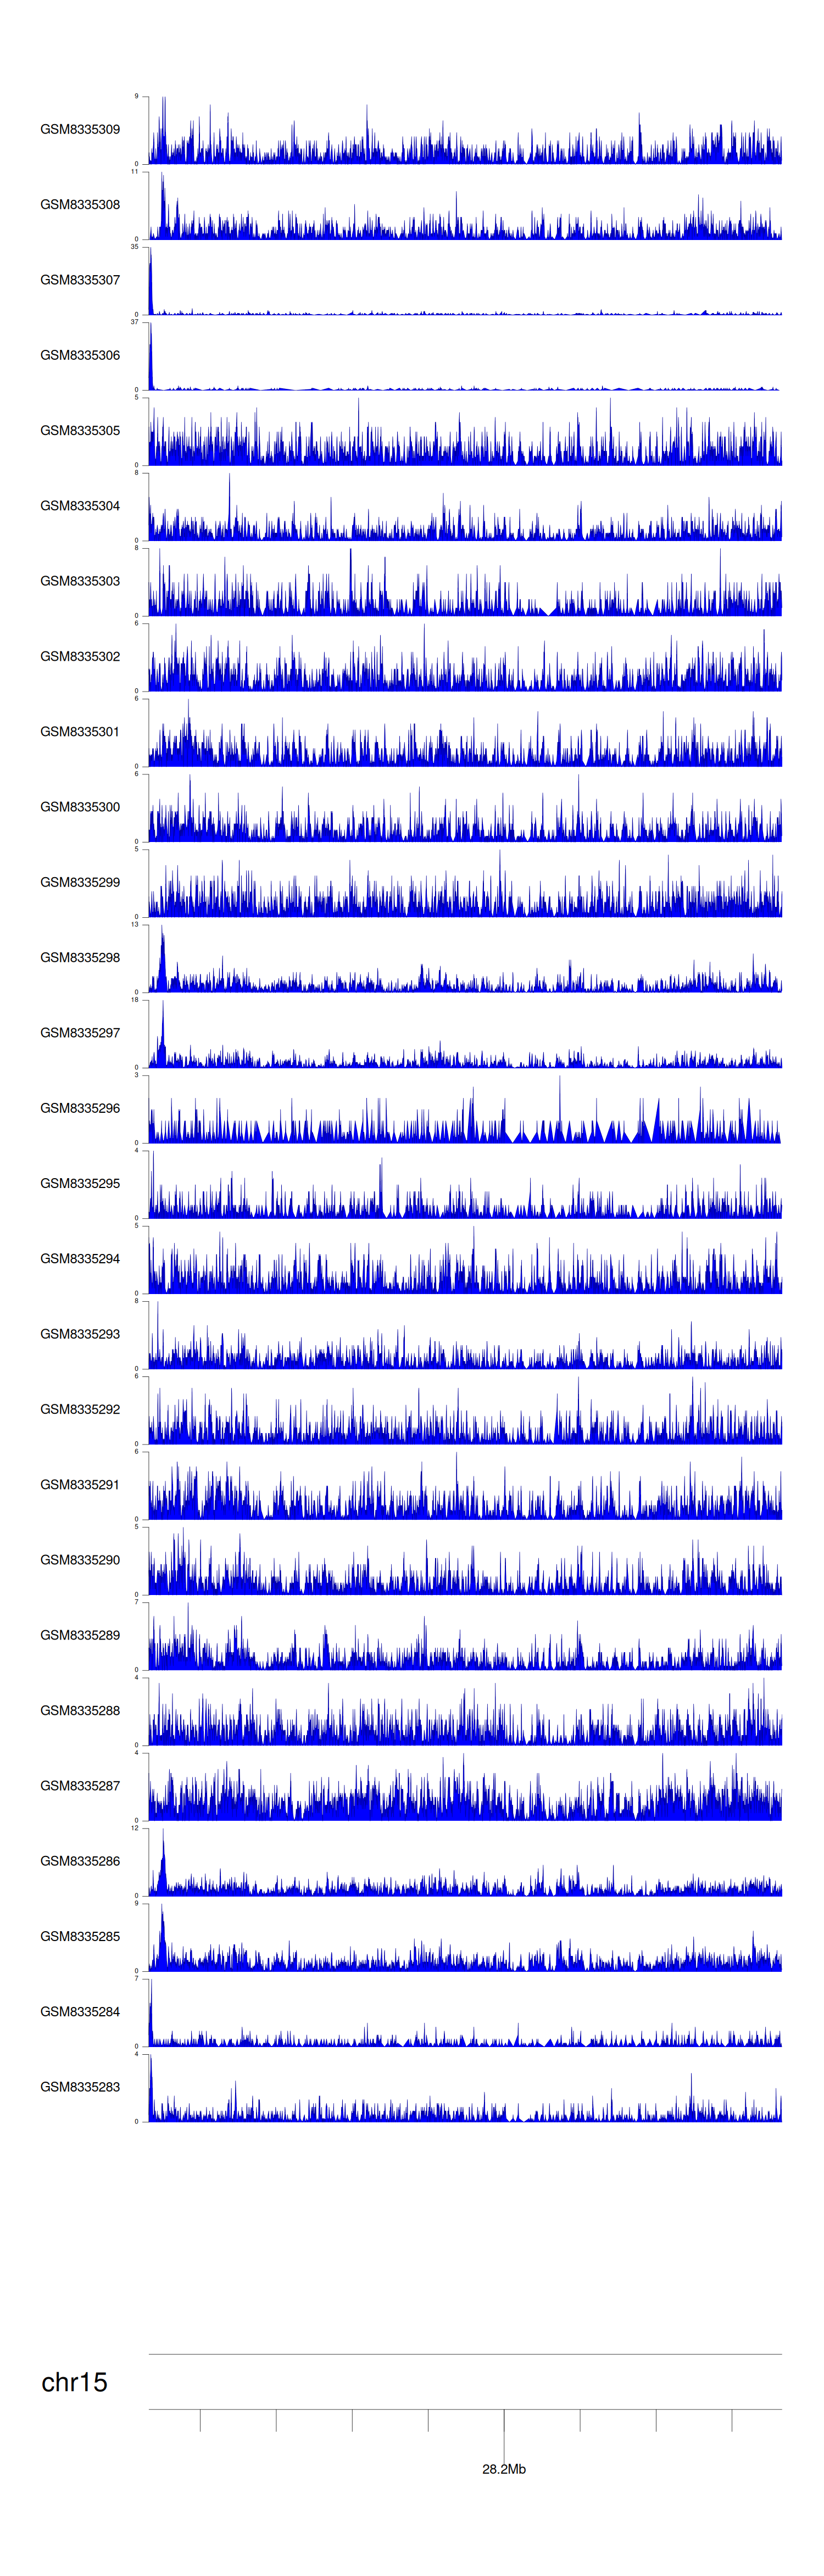
|
> Dataset: GSE131257 - HERC2 peak across samples
|
Peak Plot
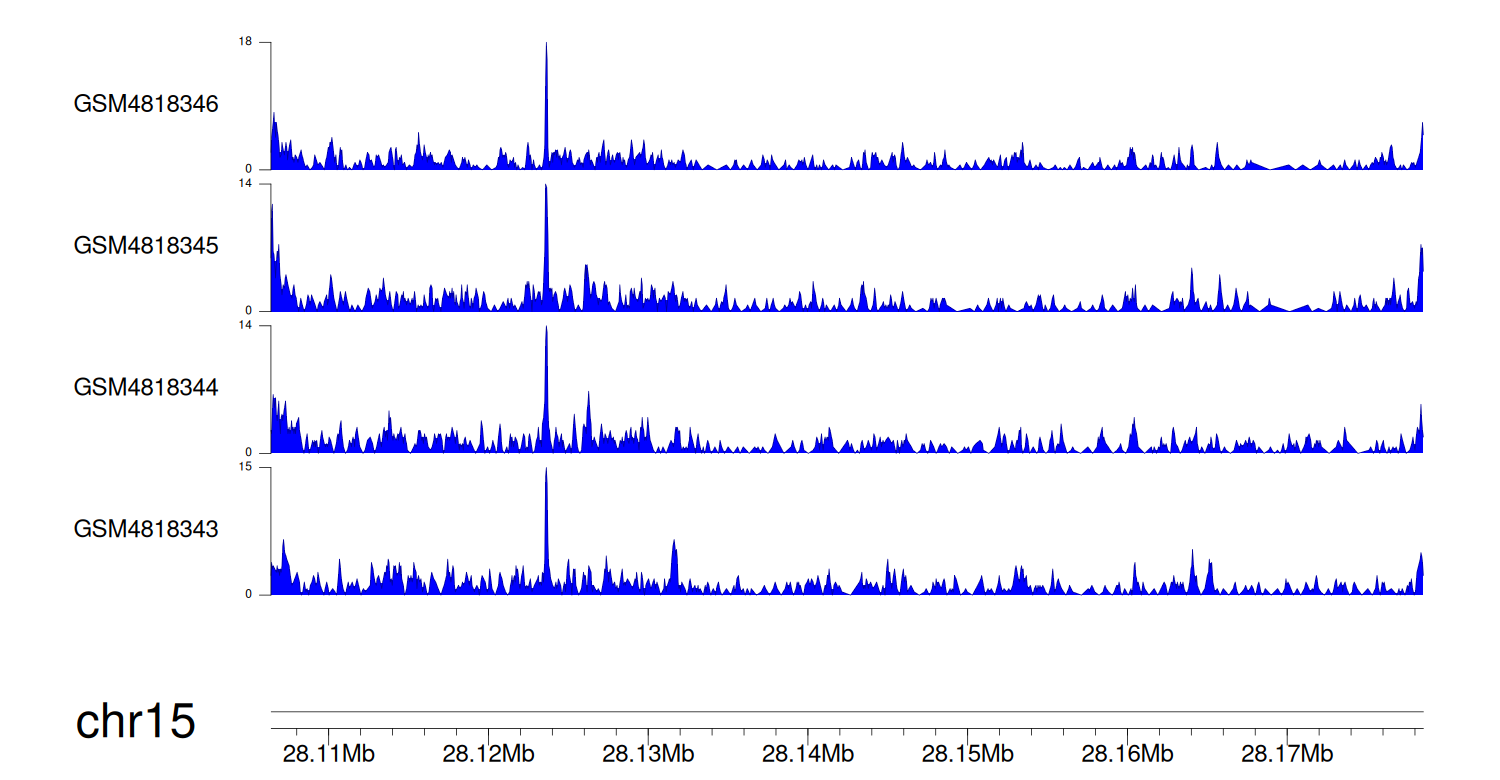
|
|
|