Gene Information
|
Gene Name
|
HS6ST3 |
|
Gene ID
|
266722
|
|
Gene Full Name
|
heparan sulfate 6-O-sulfotransferase 3 |
|
Gene Alias
|
HS6ST-3 |
|
Transcripts
|
ENSG00000185352
|
|
Virus
|
HBV |
|
Gene Type
|
protein-coding |
|
HPA Location Info
|
Nucleoplasm, Nuclear membrane;Plasma membrane, Actin filaments; 
|
|
Membrane Info
|
Metabolic proteins, Predicted intracellular proteins |
|
Uniport_ID
|
Q8IZP7
|
|
HGNC ID
|
HGNC:19134
|
|
OMIM ID
|
609401 |
|
Summary
|
Heparan sulfate (HS) sulfotransferases, such as HS6ST3, modify HS to generate structures required for interactions between HS and a variety of proteins. These interactions are implicated in proliferation and differentiation, adhesion, migration, inflammation, blood coagulation, and other diverse processes (Habuchi et al., 2000 [PubMed 10644753]).[supplied by OMIM, Mar 2008] |
Target gene [HS6ST3] related to VISs 
Integration Table: if previous studies reported that target gene was altered by virus integration events, the overlap between VISs in this literature and Cistrome factors was listed in this section
| DVID |
Chromosome |
HM |
TFBS |
CA |
Sum of Overlapped Records |
Detail |
| 1005297 |
chr13 |
10 |
41 |
7 |
58 |
View |
| 1008857 |
chr13 |
2 |
17 |
0 |
19 |
View |
| 1008870 |
chr13 |
2 |
17 |
0 |
19 |
View |
| 1013387 |
chr13 |
1 |
3 |
1 |
5 |
View |
| 1014597 |
chr13 |
2 |
0 |
1 |
3 |
View |
| 1014603 |
chr13 |
2 |
0 |
1 |
3 |
View |
| 1014946 |
chr13 |
2 |
0 |
1 |
3 |
View |
| 1020520 |
chr13 |
6 |
0 |
0 |
6 |
View |
| 1041097 |
chr13 |
29 |
24 |
1 |
54 |
View |
| 1041098 |
chr13 |
4 |
0 |
0 |
4 |
View |
| 1042053 |
chr13 |
0 |
0 |
0 |
0 |
View |
| 1042054 |
chr13 |
3 |
0 |
0 |
3 |
View |
Target gene [HS6ST3] related to Omics data
| Data ID |
Experiment type |
Sample number |
Platform |
|
GSE236281
|
RNA-seq |
12 |
Illumina MiSeq (Homo sapiens) |
|
C GSE35465
|
Chip-seq;RNA-seq |
6 |
Illumina HiSeq 2000 (Homo sapiens) |
|
C GSE68402
|
Chip-seq |
26 |
Illumina MiSeq (Homo sapiens);Illumina HiSeq 2500 (Homo sapiens) |
|
TCGA_LIHC_HBV
|
DNA methylation sequencing;RNA-seq |
97 |
TCGA |
|
C GSE270130
|
Chip-seq |
27 |
Illumina NovaSeq 6000 (Homo sapiens) |
|
GSE224901
|
RNA-seq |
21 |
Illumina NovaSeq 6000 (Homo sapiens) |
|
GSE100400
|
Chip-seq;RNA-seq;4C_cccDNA |
31 |
Illumina NextSeq 500 (Homo sapiens);Illumina NextSeq 500 (Mus musculus) |
|
GSE173897
|
RNA-seq |
95 |
Illumina HiSeq 4000 (Homo sapiens) |
|
GSE262515
|
RNA-seq |
21 |
Illumina HiSeq 2500 (Homo sapiens);Illumina HiSeq 2500 (Mus musculus) |
|
GSE110345
|
RNA-seq |
4 |
Illumina HiSeq 2500 (Homo sapiens) |
|
C GSE131257
|
ATAC-seq;RNA-seq |
19 |
Illumina HiSeq 2500 (Homo sapiens) |
|
GSE94660
|
RNA-seq |
42 |
Illumina HiSeq 2500 (Homo sapiens) |
When the gene can detect a peak in the dataset, a peak plot will be displayed.
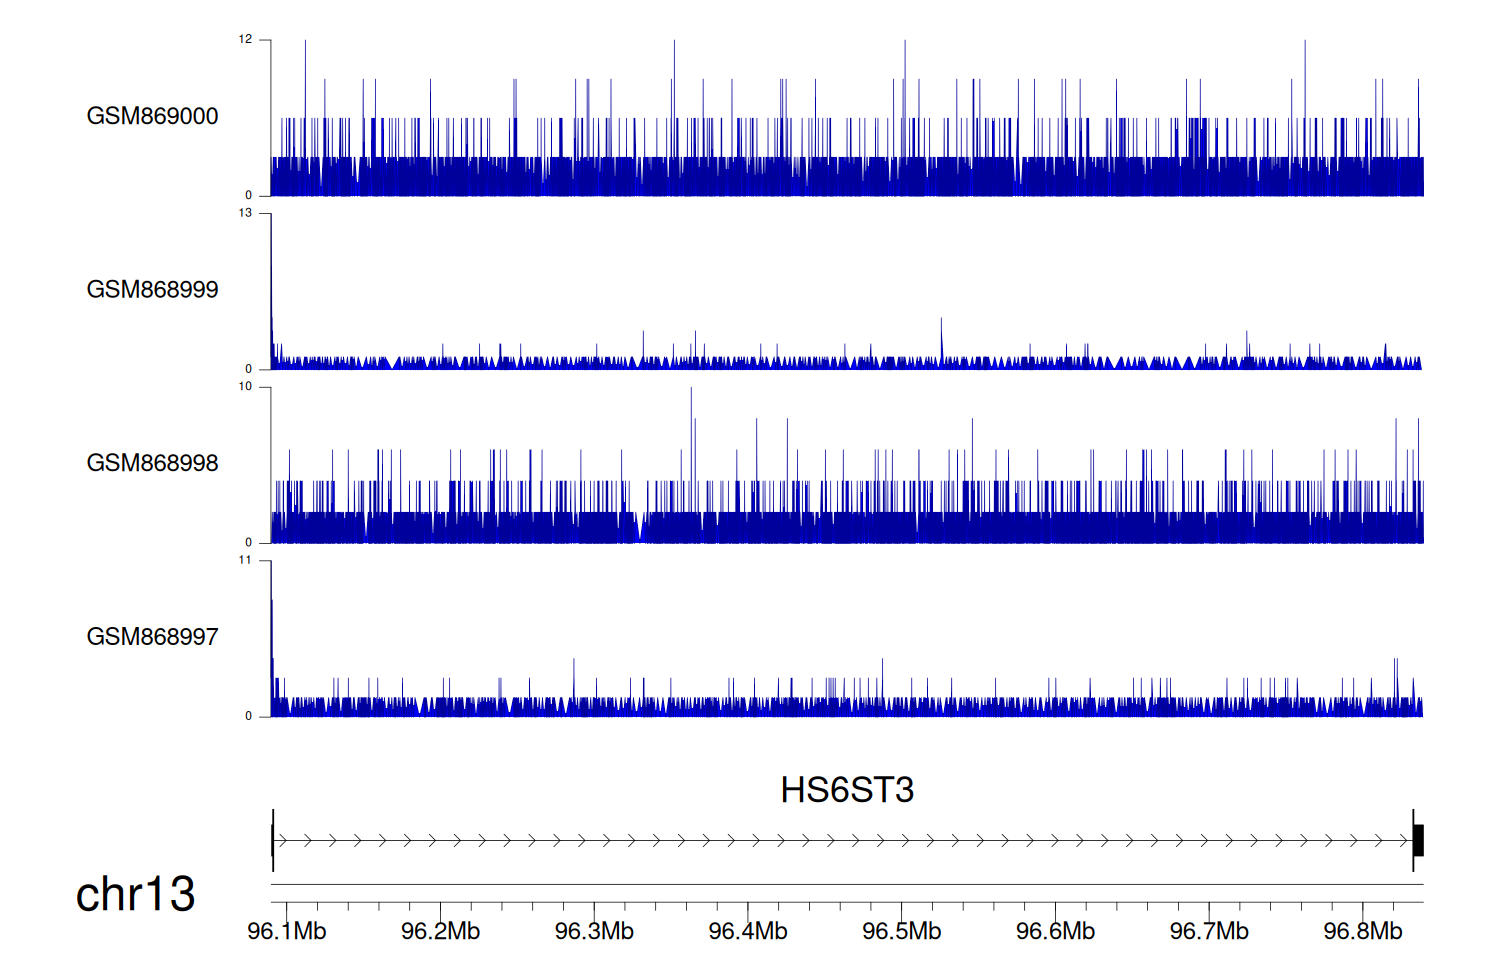
> Dataset: GSE35465 - HS6ST3 peak across samples
|
Peak Plot
|
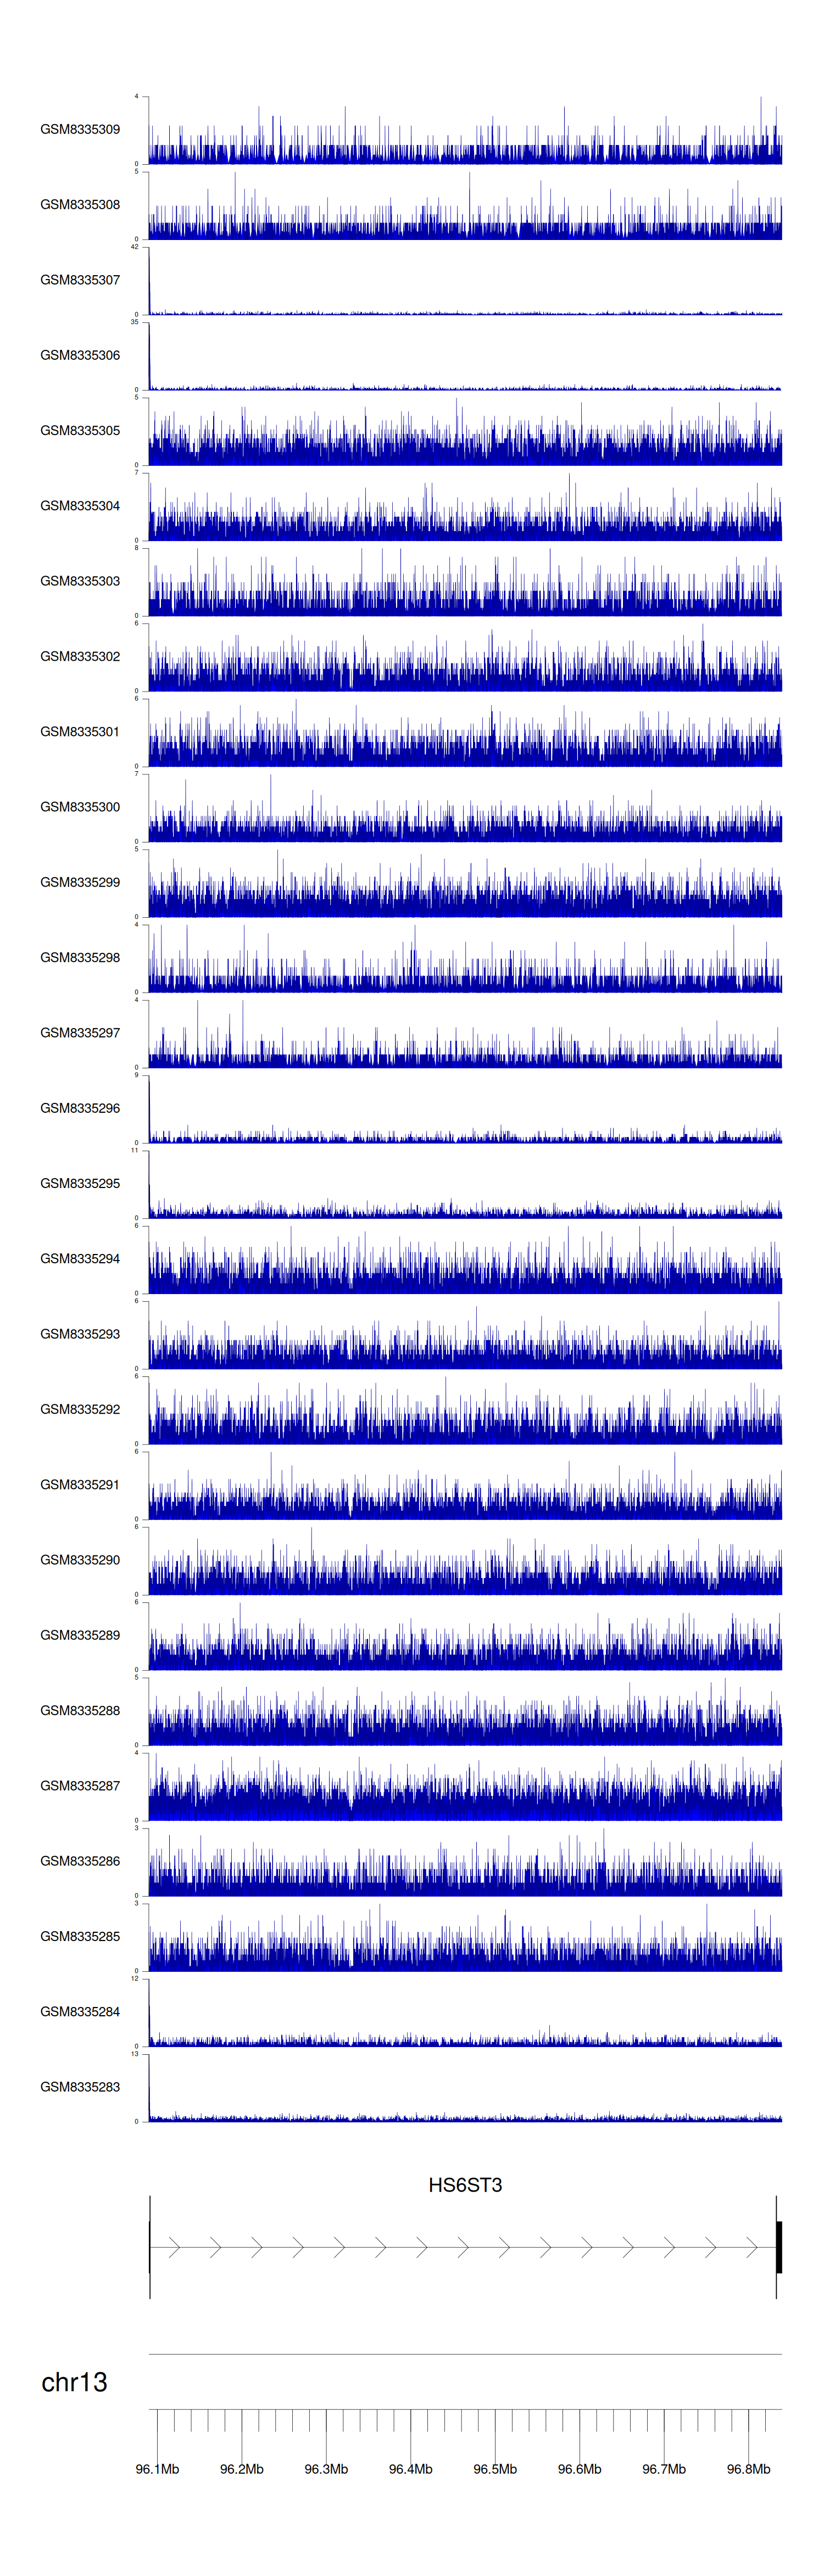
> Dataset: GSE68402 - HS6ST3 peak across samples
|
Peak Plot
|
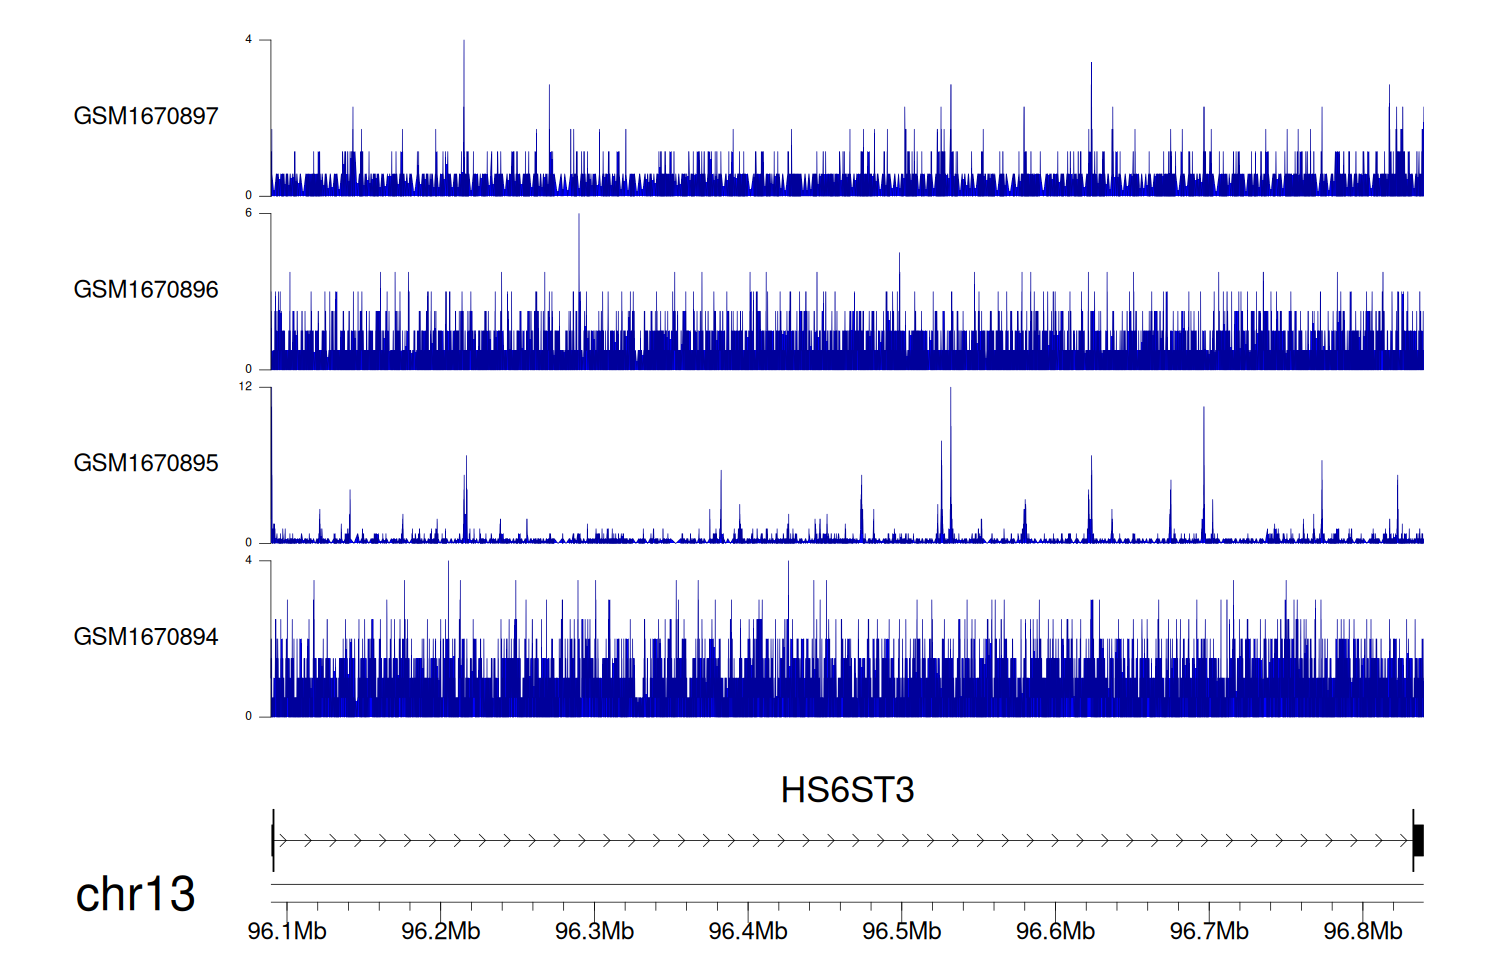
> Dataset: GSE270130 - HS6ST3 peak across samples
|
Peak Plot
|
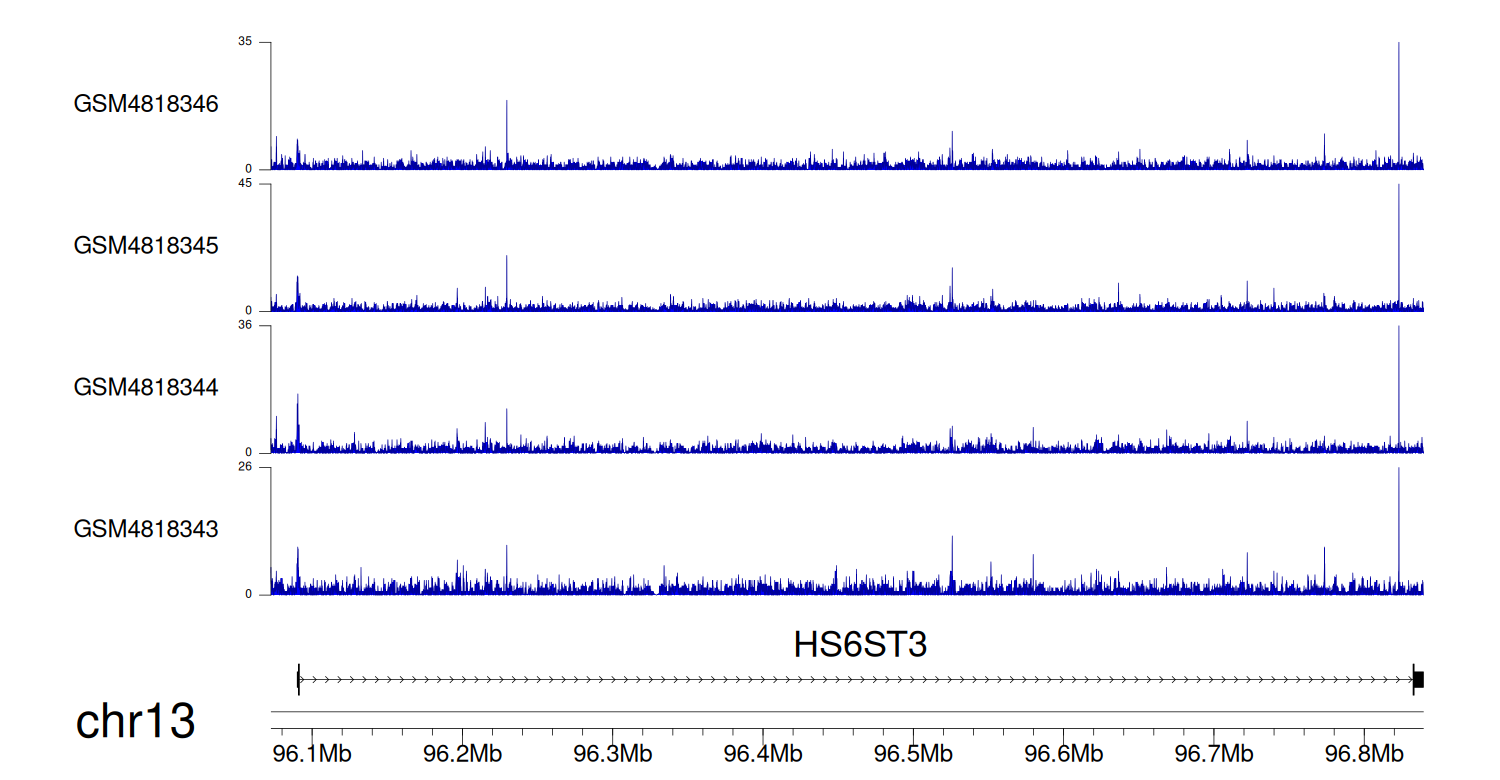
> Dataset: GSE131257 - HS6ST3 peak across samples
|
Peak Plot
|
|
|